After getting your Raspberry Pi up and running, you may want to know what´s going on with the processor, memory, temperature and stuff. You can do this with your own scripts and Cron Jobs, but i´ll also present some advanced tools in this article.
Basic Tools
Some basic tools are available on all Linux systems. Here´s a small overview:
df
You can easily get the disk usage with the following command:
pi@raspberry ~ $ df -h
The parameter “h” is important to show the results in a “human readable” format.
top
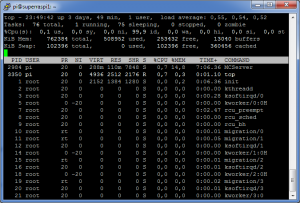
This tool is useful for checking out the current workload of your Raspberry Pi:
pi@raspberry ~ $ top
It looks a bit like the process list in the task manager on Windows and should be self-explanatory:

You can also get the average CPU load with /proc/loadavg:
pi@raspberry ~ $ cat /proc/loadavg
The first three values in the result are system load averages for the past 1, 5, and 15 minutes:
pi@raspberry ~ 0.00 0.01 0.05 1/64 7040
As you can see, my Raspberry Pi is quite bored right now.
meminfo
/proc/meminfo offers information about the used memory on your Raspberry Pi:
pi@raspberry ~ $ cat /proc/meminfo | grep Mem
vcgencmd
Raspbian already comes with a tool for basic monitoring. With “vcgencmd” you get instant access to a large amount of system values. The following command presents a list of possible options:
pi@raspberry ~ $ vcgencmd commands
This is really interesting for custom monitoring scripts. For example, you can create a simple script that reads the system temperature every minute and stores it in a file or database. You can then create a website with a fancy temperature chart. Here´s a basic shell script:
#!/bin/sh
vcgencmd measure_temp >>/home/pi/scripts/temp.txt
You can run the script in a Cron Job, it will store the current temperature of your Raspberry Pi in a file. A basic Python script could look like this:
import os;

cpu_temp = os.popen('vcgencmd measure_temp').readline()
cpu_temp = cpu_temp.replace("temp=","").replace("'C\n","");

f = open('/home/pi/scripts/temp.txt','a');
f.write(cpu_temp);
f.close();
It appends the current temperature to a text file. Of course you can improve it by adding a timestamp, or by storing it in a database instead.
External Tools
I will not explain in detail how those tools work, they usually come with a detailed tutorial how to set them up. But here´s a nice list of useful external monitoring tools for your Raspberry Pi:
Xively
Xively was known as “Cosm” some years ago. Back then it was a lot easier to use, you just created an account on Cosm, a small predefined Python script without any additional installation, a Cron Job running the script and you were finished. Now you have to install some stuff to work with Xively. It may not be a bad platform, but i would rather use something more specific.
Munin
Munin is very famous, it can be extended with plugins and is written in Perl. The documentation is not very good imho, but you can easily find tutorials for it using Google. For example:
RPi-Monitor
RPi-Monitor was written for the Raspberry Pi, as the name suggests. It comes with an interactive web interface and is pretty up to date (as of now). You can find some screenshots on the blog of the creator: RPi-Monitor Overview
Final Thoughts
The Raspberry Pi would also be a perfect device to monitor not himself, but a network. You can use it to monitor if some servers are still running, or you may want to search for “intrusion detection” with Google if you are interested in doing some security stuff.
And of course you can also use the GPIO pins with external sensors for monitoring, but that will be something for a future article 🙂